Enhancing Verification through a Highly Automated Data Processing Platform
Zheng Liming Sophia, Infineon Technologies Asia Pacific Pte Ltd
Wunna Aung, Infineon Technologies Asia Pacific Pte Ltd
Singapore
Abstract:
This paper discusses about a low cost, portable, reusable, fully automated platform implemented to enhance the verification process. This flexible platform is a VB-based data processing platform which is able to process and interpret the raw data collected from post-silicon verification tests in various formats. It provides user interactivity to do data computation, archiving and analysis. It reduces the verification process time significantly. This paper aims to raise the awareness on automated data processing platform role in accelerating the verification process, and reducing the time to market. The Touch-Sense system verification will be used as a use case study.
INTRODUCTION
The figure below shows the microcontroller development flow.

Fig 1: Microcontroller Development Flow
Post-silicon verification is the last step in the development of a microcontroller. It occurs on actual devices running at-speed in commercial, real-world system boards. It checks the new chip function in full and perfect compliance to the specification, and be delivered to the market within tight customer windows. Post-silicon verification is therefore one of the most highly leveraged steps in successful design implementation.
However, the verification becomes more and more difficult as the design complexity increases. Testing the microcontroller in system can be extremelydifficult because of the huge amount of data involved.
Therefore, data processing plays a crucial role in transforming raw data into comprehensible information.
SOLUTION
The in-house data processing platform was developed to increase the verification efficiency. It is designed to be reusable and scalable.
The platform is created using Visual basic based scripts which is suitable in handling data available on Ms Word, Ms Excel and Text format. It is standalone software which provides the users with dash board view. User is able to interact with the software in
- Selecting raw data
- Selecting conversion type
- Selecting computation type
- Archiving data
- Comparing data
- Generating report
The following figure shows the conceptual flow of the data processing platform.
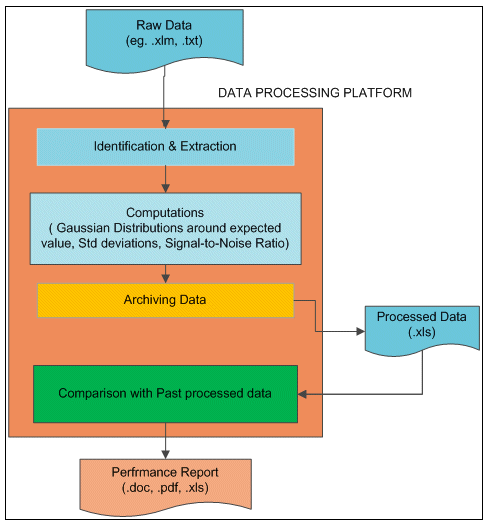
Fig 2: Conceptual Flow of Data Processing Platform
It begins with single or multiple raw data file(s) which can be in excel sheet format, text format or csv format generated by the verification system setup.
The data processing platform analyses the raw data file(s) and extracts relevant data. Then, the extracted raw data goes through various processes, for example, computation, measurement, chart plotting and performance analysis.
Afterwards, the processed data can be archived for comparison and retrieval purpose later.
Furthermore, the analysis and computation information can be documented in performance report with various formats generated by the platform.
The following figure shows the architecture of the data processing platform.
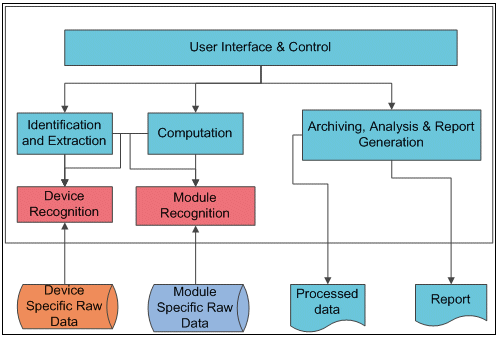
Fig 3: Data Processing Platform Architecture
It indicates identification, extraction and computation are the hardware dependent phases. Accommodation of various data format is done in these phases.
Besides, the hardware independent phases like archiving, analysis and report generation enable the portability over the devices in family concept.
Let us take Touch-Sense system verification as a use case study.
The Touch-Sense system verification flow is shown as below.
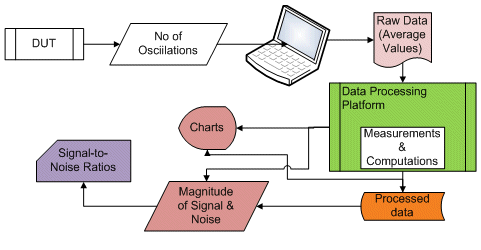
Fig 4: Touch-Sense System Verification Flow
In touch-sense system verification, the average values (number of oscillations) of all sensing channels will be generated by codes embedded in microcontroller (MCU) and streamed out through serial interface to the host PC.
Sometimes, altering the variables like sensor sizes is required in order to compare the sensor performance. Both the original values and the new values are kept; all data set are stored in .txt form.
1- Identification & Extraction
The identification script embedded in the platform is smart enough to identify the data type and data length. The scripts identify the relevant raw data and begin searching for specified information. Since the raw data contains other miscellaneous information pertaining to data structure, data size and verification process, the script must identify and extract the actual performance evaluation data of system under verification.
The diagram below shows an example of raw data.
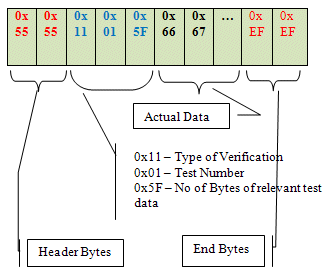
The first two bytes are the headers, the 3rd, 4th and 5th indicate relevant inform of performance evaluation. End bytes are 0xEF 0xEF and the rest are the actual desired raw data to be extracted.
Next, the extracted data goes through concatenating. The actual data is in 16-bit format which requires the scripts to remove “0x” from the second byte and join to the first byte. Subsequently the 16-bit data is converted from hexadecimal to decimal so that computations and plots can be done easily.

Fig 5: Diagram on the conversion of 8-bit actual test data to 16bit via concatenation
Then, it is transferred to multi-dimensional arrays’ variables. Multi-dimensional arrays aid in ease of computation and fast processing in an organized and deterministic way in the later stages of data processing.
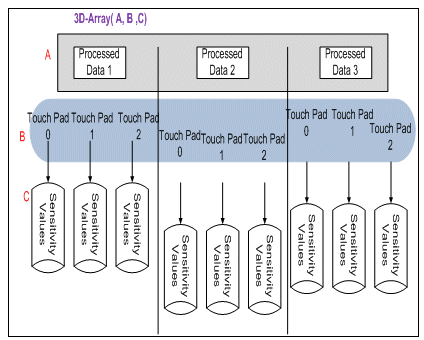
Fig 6: Diagram on the use of 3-Dimensional Arrays to store and compute data
Finally it is classified in the excel sheet. Various data logs can be combined into one sheet.
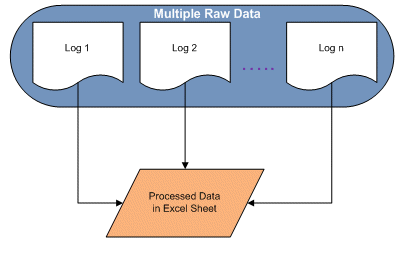
Fig 7: Diagram of multiple data logs combined into one processed data sheet
2- Computation
The touch-sense data analysis requires further computations or visualisation of extracted data.
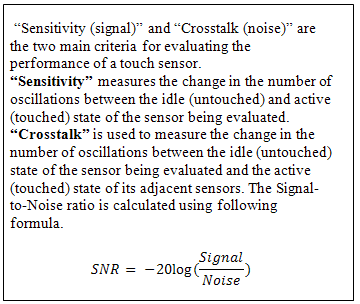
The platform enables the extracted data to be plotted onto a chart. The previously classified data is then used in plotting the level of sensitivity of a touch sensor (a channel). Multiple touch sensors can also be plotted for sensitivity comparison. These plotting are done according to the preference of the user who is provided with interface to control in the display of information.
Furthermore, the charts on the platform are not passive. User can measure relevant information such as magnitudes of Signals and Noise on the plots, so that the signal-to-noise ratio of each touch sensor can be computed. Platform is capable of automatic computation.
3- Archiving & Analysis
The data processing platform is not only reusable for processing and analysis of touch sense data, but it also allows the comparative analysis with the previously processed data.
It is important to archive analysed data for retrieval and further studies. Usually, data is archived in excel sheets.
The desirable part about comparison feature is that a large number of different past processed data can be analyzed for similarities and variations in trends within a few minutes. An example of comparison is shown below.
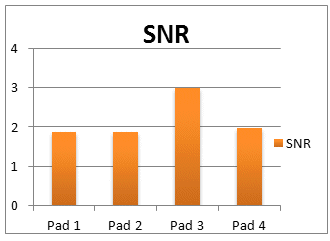
The chart shows a sample of comparison on Signal-to-noise Ratio on different Touch pads.
4- Report Generation
Verification report generation is automated from the software with a click of a button. All the information, computed values and charts generated during the processing are
Such speedy availability of reports facilitates quick feedbacks to designers or application engineers.
BENEFIT
This Automated Data Processing Platform offers a low-cost and versatile tool for fast and accurate data process. Furthermore, this platform is portable and consistent. It can easily be re-used in other verification process regardless of the PC environments and microcontrollers.
Moreover, the GUI provides visual appealing and intuitive feel that ease the user interaction with the platform.
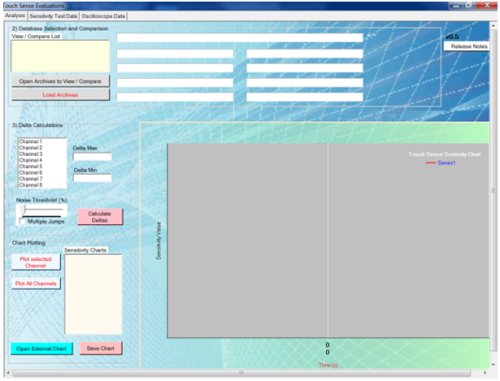
Screenshot of the Data processing Software
With this platform, we are able to shorten the Touch-sense system verification time to a great extent of 70%. This leads to the reduction of the development cost.
Lastly, as an internally developed platform, it extends the flexibility as the customisation can be done quickly.
Related Semiconductor IP
- NPU IP Core for Mobile
- MSP7-32 MACsec IP core for FPGA or ASIC
- UHF RFID tag IP with 3.6kBit EEPROM and -18dBm sensitivity
- NPU IP Core for Edge
- Specialized Video Processing NPU IP
Related White Papers
- Programmable network processing blade needed in switching platform
- A configurable FPGA-based multi-channel high-definition Video Processing Platform
- DDR3 memory interface controller IP speeds data processing applications
- Hardware - Software Tradeoffs in Automotive Sensor Data Processing
Latest White Papers
- Ramping Up Open-Source RISC-V Cores: Assessing the Energy Efficiency of Superscalar, Out-of-Order Execution
- Transition Fixes in 3nm Multi-Voltage SoC Design
- CXL Topology-Aware and Expander-Driven Prefetching: Unlocking SSD Performance
- Breaking the Memory Bandwidth Boundary. GDDR7 IP Design Challenges & Solutions
- Automating NoC Design to Tackle Rising SoC Complexity