Tuning Fork - A Tool For Optimizing Parallel Configurable Processors
by Shay Gal-On, Steve Novak, Oz Levia – Improv Systems, Inc.
Beverly, Massachusetts, United States of America
Abstract :
Modern processor architectures invariably enable the parallel execution of several operations per clock cycle. Configurable processors such as the Improv Jazz VLIW DSP allow the user to modify and customize the processor by adding new functional units, registers and opcodes. By taking advantage of such flexibility, the developer can optimize the processor as well as the application software to achieve the best performance for a given set of constraints such as silicon die size and power consumption. Such multi-dimensional optimizations are difficult to manage without specialized tools.
In this paper we describe our experience in developing Tuning Fork: a tool to assist the user in fine-tuning the match between application and processor.
1. Introduction
Modern embedded applications require more computing resources then ever before. Embedded processor architectures have evolved to cope with that need, and commonly achieve better performance by allowing multiple operations to be performed in the same cycle [16]. The parallelism can be modeled by considering a processor to be a set of functional units, each capable of executing a specific operation in any given cycle. Examples of these operations include addition, memory operations, multiply and accumulate, and other specialized operations. The degree of parallelism varies from minimal, such as those existing in a single operation per cycle RISC processor, to extreme, as exhibited by Very Long Instruction Word (VLIW) architectures. For instance, Improv System’s Jazz processor can be easily configured to execute several operations per cycle. That level of flexibility allows the user to set the level of parallelism to match the available parallelism in the application.
A developer then has several considerations in selecting the ‘optimal’ processor configuration:
1. What is the appropriate mix of resources?
2. What is the right organization for the selected resources?
3. How to ensure that the selected resources are utilized effectively where they are most needed ?
These factors give rise to complex tradeoffs between chip size, power requirement and performance [7]. Many applications, such as those found in the area of DSP, have large amounts of instruction-level parallelism in loops that can be exploited using various software pipelining techniques [5], [8], [9], [14]. Maximally utilizing this parallelism to increase performance requires a processor configuration with the right mix of parallel resources. Moreover, special purpose resources (e.g. Multiply/Accumulate units, bit-manipulation units, SIMD units, etc.) can be added to a processor to further increase performance. However, every resource added to the processor has an associated cost in terms of die size, power, and even clock frequency. What, then, is the right trade-off between cost and performance?
Designing an Application Specific Processor (ASP) can be more of an art then a science, relying on the designer’s expertise to find a combination of resources which will result in the best tradeoff between performance and other constraints. Tuning Fork aims at avoiding the guesswork, and allowing even relatively inexperienced designers to develop highly efficient ASP.
Traditional tools are capable of revealing and even optimizing dynamic software bottlenecks. These include profilers providing feedback on where the bottlenecks are [3], suggestions on optimizing the software [2], and even on the fly optimizations [4]. EDA tools are available for design and synthesis of embedded systems [15], etc., and studies were made trying to compare the efficiency of providing custom hardware instead of software operations [10], [11] etc. Tools that support processor design are not as numerous. Not many configurable processors are available to the design community and typically processor design has been the craft of few architects. Using runtime statistics, a profiling tool provides the user with a view of the application in relation to resource utilization (the focus is on cycles being the critical resource). The assumption underlined by all profilers is that the application is flexible and the processor is fixed, and therefore it is the software that needs to be optimized.
These separate approaches are inadequate for Application Specific Processors (ASP). When a suitable technology is available, as is the case with the configurable Jazz DSP processor, not only the application but also the processor itself can be extensively configured and fine-tuned towards one application. Special units, known as Designer Defined Computational Units (DDCUs [6]), can even be built and incorporated in the processor to optimally perform a key operation, (e.g. shift by a constant amount and multiply, special SIMD type operations as used in various DSP processors [12] etc., or any other hardware that is applicable to the specific algorithm being used.)
Figure 1 illustrates the development of an ASP as an iterative process. After developing and verifying the application, a specific embedded platform is targeted. From then on, an iterative process of optimization continues until all the required constraints are met: performance, die size, and power.
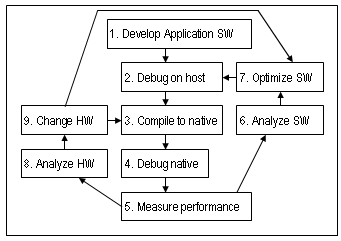
Figure 1: ASP development
Optimizing the HW (Step 9) is only possible with configurable processors. Analyzing the processor in relation to a specific application allows Tuning Fork to integrate the software (Step 6) and hardware (Step 8) aspects of the optimization process for an ASP, thus allowing previously unattainable levels of refinement in the application as a whole - both software and hardware.
Tuning Fork provides both visual and pro-active feedback to the user. The visual feedback consists of both qualitative (graphical) and quantitative (numeric) analysis of an application running on a specified processor configuration (obtained via profiling). This feedback includes per-engine, per-method, and per-block code size and cycle-accurate performance feedback, along with dynamic and static resource utilization charts (at varying degrees of granularity). It also includes cyclic and acyclic dependence chain analysis that provide a hard lower bound on performance. Using this information, the user is able to isolate performance bottlenecks and gain insight into their cause.
The ability to visualize and understand performance bottlenecks greatly facilitates HW/SW optimization. However, Tuning Fork enhances this capability further by providing proactive feedback to the user in the form of specific suggestions about how to reconfigure or augment the processor to meet cost vs. performance objectives. Some examples of this feedback include:
- data layout suggestions to improve performance,
- unit to instruction slot mappings to decrease instruction width without impacting performance,
- units that can be eliminated without significantly affecting performance,
- units that can be added to improve performance (along with estimates of the performance to be gained),
- potential source-level improvements, such as using “range assertions” to enable more aggressive (less conservative) optimization by the compiler.
The remainder of this paper is organized as follows:
In section 3, we outline related work in the field. We describe work done on profiling and using the results of profiling for performance enhancement, as well as work on adapting hardware to software needs.
In section 4, we describe the framework for Tuning Fork, and give some background on the Improv Jazz DSP architecture and present a sample application to provide a reference framework while presenting the capabilities of Tuning Fork.
In section 5, we describe our strategy of assisting the programmer in finding an optimal hardware configuration for a specific application.
In section 6, we describe our strategy of assisting the user in picking an optimal overlapping of resources to conform to a specific instruction width.
In section 7, we describe some of the algorithm we are using to collect, analyze and present the information to the user in a coherent visualization framework.
Finally, in section 8, we summarize the benefits of our approach and discuss future activities.
2. Related Work
There are many tools aimed at discovering code bottlenecks, providing information regarding the application at the bottlenecks, and even optimizing the application based on profile feedback.
Tools such as VISTA [13], even aim at making the user understand the HW-SW interaction. Like Tuning Fork, VISTA provides both qualitative and quantitative feedback to the developer, which allows him to visualize resource utilization (both dynamic and static) and identify performance bottlenecks. However, unlike Tuning Fork, VISTA does not provide any pro-active suggestions to the user – VISTA’s feedback is entirely passive.
Tools such as VTune [2], direct the application developer to the application bottlenecks. VTune can even provide suggestions on application modifications for common cases.
Other tools try to optimize the application code at runtime, relying on profiling information without user intervention. Dynamo, [4] for example, will dynamically select an execution trace based on profile, and apply various optimizations to the code. The optimized code is then executed instead of the original code. However, none of those tools take into account the possibility of changing the processor itself to relieve the bottleneck.
In Tuning Fork, our main focus is on the processor, and potential changes to the processor that will result in a better product: faster and/or more cost effective. The process of optimizing ASP for a specific application already relies on the fact that the designer knows the application and the processor. However, using Tuning Fork, the designer gains insight into the workings of the compiler. The designer can also reduce the design time significantly, since Tuning Fork already analyzes the performance bottlenecks over the whole application, and lets the designer know which changes to the hardware will be most effective in addressing them.
3. Improv Jazz DSP processor capabilities
Improv Jazz DSP is a scalable, configurable, high performance VLIW multi-processor [18], [19].
Jazz processor’s Computations Units (CU) and Memory Interface Units (MIU) VLIW structure is controlled via instructions slots. Jazz has a shallow pipeline and most instructions are completed in two cycles (including the fetch). The Jazz processor uses a Harvard memory architecture, where data and program have different address spaces. It does not have a register file and registers are distributed in the various CUs and MIUs. The processor uses multiple task queues to control the order of execution (including interrupts) and includes power features. Like many DSP processors, Jazz supports multiple Data memories (Figure 2).
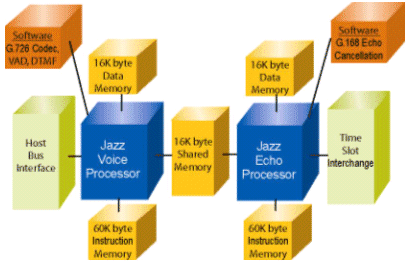
Figure 2: A Jazz platform with 2 processors and multiple memories.
Several aspects of the Jazz processor are configurable. These include:
- Available instruction set: Jazz processors can integrate user defined computation units, allowing integration of custom hardware.
- Number of available registers for each computation unit: Rather than a general register file, each computation unit has its own set of registers.
- The type and number of computation units on the processor.
- Slot overlapping: One of the issues with VLIW architecture is instruction width. Jazz processors allow the designer to balance between parallelism and instruction width by overlapping several computation units into one VLIW slot.
- Memory interfaces: Jazz processors support multiple flexible memory interfaces to increase memory bandwidth, and to allow multi-processor communication via memory. Memory interfaces can be configured for specific memory sizes and special addressing modes.
Jazz Tools and Flow
When developing embedded SW for the Jazz processor, the user has a full set of development tools. While our focus in this paper is the optimization and configuration of the processor with the aid of Tuning Fork, it is important to briefly describe some of the other tools:
Notation Environment: High-level verification and SW development tool for embedded applications.
Composer: Allows the developer to define a processor – configuring any of the elements mentioned above, and in some cases using multiple processors to create a platform defining memory sizes, processor types, and the connections between them.
Jazz PSA Compiler: a retargetable compiler for C and Java source code. Jazz PSA Compiler, when invoked, loads in the target native platform, and compiles the application to perform optimally on the target platform.
Once the application code has been compiled to a specific platform, the user has two options to measure performance:
- Annotate the application source with cycle counts for basic block in the source itself, and run in Notation.
- Accurate simulation with an instruction set simulator.
The output from any of the methods above is a profile that can be correlated to the application source code. This profile is used by Tuning Fork, in conjunction with data collected during the compilation, to provide the user with visual representation of resource utilization on the various processors. In addition Tuning Fork attempts to analyze the match between the application and the processors, and suggests configuration changes that are likely to increase performance. Tuning Fork analyzes resources that are under-utilized, and will also suggest specific slot overlays if the developer is looking to decrease instruction width or change memory layout to increase memory bandwidth, in addition to other insights that assist the developer in perfecting the match between the platform and the application.
Sample Application:Voice Processing System (VPS)
For the remainder of this paper, we will refer to a sample application: a 16-channel Back-Office VPS (at 100MHz). The application uses a voice codec (G.726), and an echo canceller (G.168) for voice processing. The basic processor chosen for this application was a default Jazz DSP processor containing 1 multiply-accumulate unit, 1 shifter unit, 3 ALUs, and 3 memories.
4. Visualizing and Solving Performance Bottlenecks
Most DSP algorithms follow the 90/10 rule, that is – 90% of program execution time is taken by 10% of the code. Typically those 10% are tight loops and the programmer spends most of the effort analyzing these tight loops to meet performance goals. Our goal then is first to identify these highly executed blocks of code, and second to assist the user in speeding up the execution of these blocks, either by changing the code, or by changing the hardware.
To identify the highly executed blocks of code, we rely on profile information [17]. Each basic block in the code is matched with two main values: the number of cycles a single execution of the block takes, and the number of times the block is executed.
We present this information (figure 3, panel 1) in a spreadsheet format that allows sorting using different criteria. Panel 1 allows the user to easily navigate to different basic blocks of interest. Once a specific basic block is chosen, the information panels are filled with relevant information: the corresponding source code (panel 6), the resulting assembly code (panel 5), static utilization of hardware resources in this block (panel 2), and summary information about the block collected during compilation (panel 4). Per-cycle utilization is also available to correlate specific assembly and dependence chains to the various resources (Panel 3). The summary information includes statistics such as total cycles and number of operations per cycle, flow type of block (inner loop, outer loop etc.), length of dependence chain, presence of cyclic dependencies, etc.
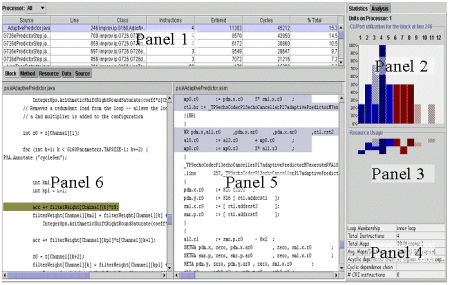
Figure 3
This information allows the user to quickly answer the following question: Can the execution of this basic block be improved by using different hardware? If the length of dependence chain in the block (or cyclic dependence chain in loops) is smaller than the cycles the block execution requires, then there is a hardware bottleneck. The user can correlate the assembly code with the source code, and perhaps gain insight as to how the hardware or the software might be improved for a better match. The user may also want to know which hardware resources are most likely blocking the execution? The utilization graph shows the usage of each hardware resource. For loops that can be pipelined, any highly utilized resource may be a blocking resource unless the loop has a cyclic dependency blocking further optimization.
Tuning Fork also provides analysis in the associated analysis panel. The analysis includes any resources deemed by the compiler to be blocking execution, as well as an estimate of the performance gain should the bottleneck be resolved.
For example, looking at the VPS application default processor in figure 3, we can see that a block in the AdaptivePredictor source code is taking up 15.3% of the application execution time. Looking at the block analysis yields the fact that this is an inner loop with no cyclic dependencies.
On the Jazz Processor, a branch has one cycle latency, meaning that it should be possible to execute the loop in two cycles. However, we observe that the loop takes 4 cycles. We also observe that slot 4 is 100% utilized by the Multiply Accumulate unit (named mp0). Indeed, looking at the analysis provided by Tuning Fork, we can see that the Multiplier unit is a bottleneck in this block, as well as an estimate of the cycles to be gained by adding another Multiply Accumulate unit (Figure 4).
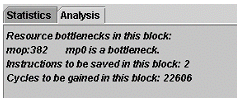
Figure 4: Analysis results for main loop in Adaptive Predictor source code
Another important issue when trying to optimize hardware bottlenecks is even harder for the user to tackle without an automated tool. Any change in the hardware is likely to affect multiple blocks. Estimating the effect of adding or removing resources on the overall performance of the application is extremely valuable. On the one hand, the programmer can always create a new configuration and get the results after compilation. However, trying all possible combinations is simply not feasible. Instead, we use Tuning Fork to provide an overall view of the interaction between the processor and the application (Figure 5).
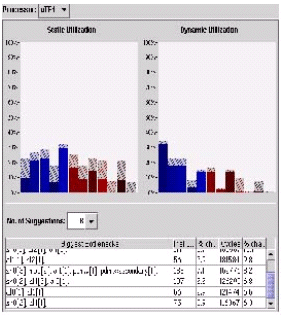
Figure 5: Global view. Top left – static utilization. Top right – dynamic utilization. Bottom – resource bottlenecks analysis for the processor.
The overall view includes graphs of static and dynamic resource usage for all the tasks executed on the processor. In addition, the overall view contains a summary of all the resource bottlenecks found on the processor, and the estimates of their effect on program size and performance. These estimates are extremely valuable to the user, since they predict the effect of adding multiple resources over the whole program rather than a single block. In addition, resources that affect a lot of insignificant blocks might come to light.
For example, in the VPS application, AdaptivePredictor is the single most significant block, and adding a multiplier will reduce ~22,000 cycles. However, the global analysis yields that a lot of blocks will benefit from adding an ALU, with a cumulative effect estimated at ~10,000 cycles.
We can also observe that two of the memories are only used for reads and never for writes. This will allow the designer to use memories with read-only ports for those memories.
Memory related bottlenecks may be resolved by simply redistributing the data elements to different memories. Here too, Tuning Fork provides suggestions based on profile information. As we observe in figure 6, Tuning Fork suggests a specific memory location for each data element. These suggestions are based on profiling information and memory bandwidth requirements.
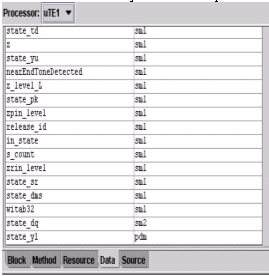
Figure 6: Data allocation suggestions for the VPS application
5. Overlapping slots
One of the disadvantages sometimes associated with VLIW architecture is the program or instruction word size. There are several ways to deal with this issue:
- Instructions of various width. This approach allows efficient use of the instruction memory. However, various compromises are then forced on the designer: less parallelism, complicated decoding stage leading to deeper pipeline, or other hardware aspects. Popular architectures such as the Intel 32 bit processors use this method.
- Instruction compression. This solution allows efficient use of instruction memory. However, this does not solve the issue of the length of the instruction word itself. The longer the instruction word, the more complicated the associated instruction memory hardware. Also, instruction compression is not very effective when the code is control flow intensive. This method also contributes to higher complexity in the decoding stage. Improv processors use instruction compression to decrease instruction memory size, since most DSP algorithms have little control flow.
- Decreasing the number of resources available for parallel execution. Using this method, the designer can balance between the need to reduce the width of the instruction and the performance requirements. This method needs to be applied very carefully since decreasing the amount of parallelism might result in a bigger memory footprint. RISC machines are the prime example, reducing the available parallelism and executing only one operation per cycle. This allows RISC machines to operate at higher frequencies, and deep pipelines enable efficient execution of loop code.
On the Jazz platform, the programmer can control the instruction word size without reducing the number of resources on the processor by overlapping resources into a single instruction slot. However, doing so will decrease the amount of parallelism available, potentially increasing the number of instructions in the program. The user is then faced with the challenge of finding the correct units to overlay such that the instruction width is within bounds, yet the performance is not penalized too much. This is a multi dimensional problem as the user needs to select the units to use, the number of VLIW slots and the right organization for the units in the slots.
To assist in this task, Tuning Fork collects data on unit usage during scheduling. The designer is then able to input the desired instruction word length, and Tuning Fork will correlate the data collected with profile information to find a distribution of units to slots that is likely to inhibit parallelism the least, and achieve the best performance for the application in question.
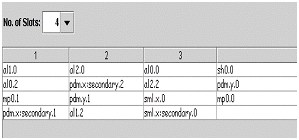
Figure 7: Slot overlapping for 4 slots on the VPS application as suggested by Tuning Fork
For the VPS application, selecting 4 slots yields an allocation that results in a minimal number of resource conflicts. Of course, the application performance will be affected. However, Tuning Fork points out the less obvious overlaps such as the fact that it is least damaging to overlay both slots of the pdm MIU. The memory is used for both reads and writes, but only scanning all the execution blocks and factoring profile information reveals that those are not usually executed in parallel.
6. Algorithms
The mini scheduler:
The Jazz PSA Compiler uses Mutation Scheduling [4] and Resource-Directed Loop Pipelining [14] to parallelize and schedule application code for the Jazz DSP processor. After scheduling, a fast mini scheduler pass is used to detect resource bottlenecks. The pass is an enhanced basic block list scheduler, which marks any resource that is blocking an optimal schedule (optimal schedule being defined as a schedule in which the block execution time takes no longer then the longest dependence chain). Whenever a resource is identified as blocking the scheduler, the mini scheduler creates a virtual resource that is identical to the blocking resource, and that resource becomes available to the mini scheduler.
Even though the virtual resources are created anew for each block, we want to identify similar resources that were created for different blocks. The method we are using is a naming convention. All the base resources in the configuration are annotated with .0 (e.g. ALU.0), and whenever a virtual resource is added, it is named after the original unit in ascending order (e.g. ALU.1, ALU.2 etc.).
This method, while not completely accurate, (as it does not take into account possible changes in register allocation and other transformations that might become possible/valuable in the presence of more hardware resources), provides a good approximation of the effect that removing the resource will have on the block. This method is particularly effective for pipelined loops, which tends to be the area the user is most concerned with in DSP applications.
Overlapping units:
During the mini scheduler pass, we collect the information about the usage of every functional unit in every cycle (including the added virtual slots). We then use this information to create a matrix for each block that marks how many times each pair of units was used in parallel in the block. This information is then read in by Tuning Fork, and correlated with the profile data. For each collection of blocks, we are then easily able to determine which units can be overlapped with the minimal performance impact, by adding the matrices (taking into account virtual units). After each overlap, we simulate the effect by combining the rows/columns of the overlapped functional units.
7. Summary and future activity
In this paper, we presented Tuning Fork – a tool aimed at assisting developers in creating a match between the application and the processor. This tool is unique in aiming primarily at the capability of changing the processor. The tool aids the user operating in two facets:
- A visual representation of the Application/Processor interaction that aids the designer in understanding application bottlenecks. The visual representation also provides insight into the compiler analysis of the code.
- An analysis framework, where Tuning Fork suggests various processor changes. Tuning Fork estimates the effect of changes on performance, and suggests changes that are likely to result in better parallelism and hence better performance.
Tuning Fork at current does not provide the designer with suggestions regarding customized hardware that does not already exist on the processor. It is our intention to provide analysis of code fragments that can lead to various custom hardware units. For example: operations that are likely to benefit from SIMD type manipulation, chains of operations that use a constant, multiple operations that use the same input, and more.
Tuning Fork also provides cost estimates for the various suggested processor changes, focusing mainly on the performance and code size aspects. We intend to extend and enhance these estimates to include power estimates, and provide quick estimates for various user changes (a quick what-if analysis).
8. References
[1] The Semantics of Program Dependence (1989)
Robert Cartwright, Matthias Felleisen.
SIGPLAN Conference on Programming Language Design and Implementation
[2] Intel Corporation. VTune Performance Analyzer 4.5. http://developer.intel.com/vtune/analyzer/index.htm
[3] gprof: a Call Graph Execution Profiler (1982)
Susan L. Graham, Peter B. Kessler, Marshall K. McKusick
SIGPLAN Symposium on Compiler Construction
[4] Dynamo: A Transparent Dynamic Optimization System (2000)
Vasanth Bala, Evelyn Duesterwald, Sanjeev Banerjia
SIGPLAN Conference on Programming Language Design and Implementation
[5] Mutation scheduling: A unified approach to compiling for fine-grain parallelism.
S. Novack and A. Nicolau.
In Languages and Compilers for Parallel Computing, pages 16--30. Springer-Verlag, 1994.
[6] "Embedded Tools & Compilation Techniques for a Reconfigurable and Customizable DSP Architecture"
C. Liem, F. Breant, S. Jadhav, R. O'Farrell, R. Ryan, O. Levia
Proc of the IEEE/ACM Co-design Symposium, pending publication, Estes Park, CO, May, 2002.
[7] Multidimensional Exploration of Software Implementations for DSP Algorithms (1999)
Eckart Zitzler, Jürgen Teich, et al
VLSI Signal Processing Systems
[8] Software Pipelining (1995)
Vicki H. Allan Reese B. Jones Randall M. Lee Stephen J. Allan
ACM Computing Surveys
[9] Rau B. R., "Iterative modulo scheduling: An algorithm for software pipelined loops"
Proc. of 27th Annual Int'l Symp. on Microarchitecture, pp. 63--74,
Dec.1994, San Jose, California.
[10] Software Synthesis and Code Generation for Signal Processing Systems Shuvra S. Bhattacharyya, Rainer Leupers, Peter Marwedel
IEEE Transactions on Circuits and Systems---II: Analog and Digital Signal Processing, 47(9):849--875, September 2000. 9
[11] Trade-Offs in HW/SW Codesign
Wolfram Hardt, Raul Camposano
Proceedings 4th ACM Workshop on Hardware/Software Codesign, Pittsburgh, PA (USA), March 1996
[12] Exploiting SIMD parallelism in DSP and multimedia algorithms using the altivec technology.
Huy Nguyeni and Lizy Kurian John.
13th International Conference on Supercomputing, 1999.
[13] VISTA: The visual interface for scheduling transformations and analysis.
Steven Novack and Alexandru Nicolau.
In Languages and Compilers for Parallel Computing. Springer-Verlag, LNCS 768, 1993
[14] Resource-Directed Loop Pipelining. Steven Novack and Alexandru Nicolau. The Computer Journal, Oxford University Press, 40(6), 1997
[15] Hardware-Software Co-Design of Embedded Systems: The Polis Approach.
F. Balarin, M. Chiodo, P. Giusto, H. Hsieh, A. Jurecska, L. Lavagno, C. Passerone, A. Sangiovanni-Vincentelli, E. Sentovich, K. Suzuki, and B. Tabbara.
Kluwer Academic Publishers, 1997
[16] Instruction level parallelism for reconfigurable computing.
T.Callahan and J.Wawrzynek.
8th International Workshop on Field-Programmable Logic and Applications, September 1998.
[17] Optimally profiling and tracing programs.
Thomas Ball and James R Larus.
In ACM Transactions on Programming Languages and Systems, volume 16, pages 1319--1360, July 1994.
[18] Jazz 2.0 architecture whitepaper
Steven. H. Leibsen
Microprocessor Report, Mar. 2000
[19] Jazz 2.1 architecture reference guide
Improv Systems,
Jan. 2002.
Related Semiconductor IP
- NPU IP Core for Mobile
- NPU IP Core for Edge
- Specialized Video Processing NPU IP
- HYPERBUS™ Memory Controller
- AV1 Video Encoder IP
Related White Papers
- A closer look at security verification for RISC-V processors
- SignatureIP's iNoCulator Tool - a Simple-to-use tool for Complex SoCs
- Configurable processors or RTL -- evaluating the tradeoffs
- Configurable Processors: Ready for Prime Time
Latest White Papers
- Ramping Up Open-Source RISC-V Cores: Assessing the Energy Efficiency of Superscalar, Out-of-Order Execution
- Transition Fixes in 3nm Multi-Voltage SoC Design
- CXL Topology-Aware and Expander-Driven Prefetching: Unlocking SSD Performance
- Breaking the Memory Bandwidth Boundary. GDDR7 IP Design Challenges & Solutions
- Automating NoC Design to Tackle Rising SoC Complexity