Real Time Non-intrusive Debugging Framework
Steven He, Cheong Siew Lee
Microcontroller Development
Infineon Technologies AP Pte Ltd, Singapore
Abstract
Conventional debugging technique is usually intrusive to the program execution, at time it may require halting of the program flow. This is risky especially in timing critical application, and it may lead to the unrecoverable system damage. This paper briefly discusses a low cost non-intrusive debugging methodology, specifically focus on the timing critical environment. Real time monitoring is the key consideration; other key considerations will be evaluated from hardware, firmware and software aspects, in order to make the setup as flexible as possible. Findings of a case study will also be shared in the subsequent section on this proven methodology.
1. Introduction
Debugging is considered one of the most important steps in the development process; in fact this is one of the major activities during the early phase of the development. Having the right debugging tool from the beginning will significantly reduce the unproductive effort. Nevertheless, a single debugging tool may not be sufficient to complete a product development. As the saying goes, good mechanics have many tools; one can’t fix a car with just a hammer. Like good mechanics, good developer needs to be proficient with a variety of tools at different phase of development. Right tool promises great insight into the system operation, and it helps the developer quickly spot problems or issues that would take days to discover by other means.
Two of the most common debugging techniques used in embedded system development are:
- Simple printf statement – flexible and primitive tool, but it requires developer to insert the instrumented code at specific location in order to obtain the necessary information. Moreover, this technique can be intrusive, especially in the low processing power CPU where it tends to slow down the intended application execution.
- JTAG debugger – the unit is heavily used during the early stage of the development, as it allows the developer to have full control of the CPU, step through every line of the code in ROM or flash, and change the value on-the-fly. However, the unit usually halts the program flow in order to perform the intended debugging activities; this may not be acceptable under timing critical environment which may lead to stability issue of the system performance.
1. Framework Consideration
The debugging framework considers three main aspects:
- Suitable for low-processing power CPU; it is targeted on 8-bit microcontroller.
- Must be able to provide the intended information in real time without halting the application flow.
- Target DUT independent, where the implemented methodology can be reused on any other platform with minimum porting effort.
Figure 1 illustrates the proposed framework in order to realize the above considerations.

Figure 1: Components of the Debugging Framework
The framework can be described in three sections, namely the PC-host software, the DUT monitoring device and the DUT debugging framework. Communication interface between the components are shown in the arrow description.
A. PC-host Control & Monitoring Software
This is the main interface for user to perform the debugging activity of the DUT. The idea is to provide a configurable, simple to use and meaningful interface for user to perform real time debugging, without halting the program flow.
As shown in Figure 1, the software mainly consists of two windows. The first window, as shown in Figure 2, shows the required debugging information by the end user. This means that under different application development scenario, the user is free to choose what debug information to be shown. For example, the edit field can be used to display the DUT internal RAM value. User can also customize a button for an application specific command, or to use a radio button to indicate “pass” or “fail” status.
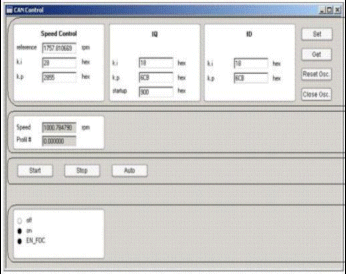
Figure 2: Configurable user interface PC-host software
The second window is an on-screen oscilloscope that allows the user to monitor the DUT internal states and parameters over a configurable timescale. Instead of receiving these states data in numerical form, the screen is very useful. It allows user to monitor internal state in graphical form, therefore user can observe a fix pattern of occurrence.
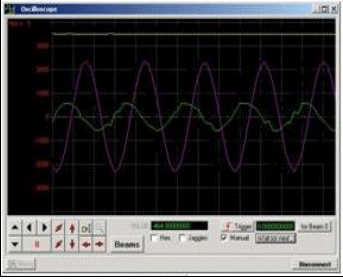
Figure 3: On-screen oscilloscope PC-host software
B. DUT Monitoring Device
This is the hardware unit that realizes the target DUT independent requirement. This low cost device consists of a USB chip for PC interface, and an 8-bit microcontroller. The microcontroller provides JTAG and CAN interfaces for the target DUT:
- USB interface: to send PC command and receive the debug information from the target DUT.
- JTAG interface: to download the software into target DUT. Intrusive debugging is also possible via here.
- CAN interface: to stream the required DUT parameters when the application is running. The bandwidth of CAN bus can be up to 1 Mb/s, therefore it is possible to set and monitor the required parameters in real-time.
C. DUT Debugging Framework
This is a framework that encapsulates with user application to provide the necessary debug information to the PC-host software. User is free to customize the framework to suit the target application. With low cost in consideration, the framework footprint is small enough to fit into an 8-bit microcontroller.
The DUT debugging framework consists of two components:
- Scheduler – Timer unit is used to perform routine job and to send the required data to the PC-host software at user defined interval. User can choose to use more timers for multiple schedulers to send different debug information. The software will display the real time and non-real time data in graphical form.
- CAN command processor – The target DUT CAN peripheral is utilized to process the incoming command sent by PC-host software. This interface is also used to send the debug information triggered by the scheduler.
With target DUT independent in mind, the framework is written in C language and the hardware layer is abstracted. This enables the porting to other platform with minimum effort.
With the above framework, the three main objectives as highlighted in Section 2 are fulfilled. The following section will highlight a case study. It shows that the proposed framework requires minimal CPU resources and suitable for low-cost 8-bit microcontroller.
3. Case Study: Debugging Class B Software Library
The Class B Software Library is developed in compliance to the IEC60730 Annex H standard. The Software Library consists of a set of self-test routines to identify faults in the core registers, CPU clock and memory (both variable and invariable) in the MCU.
The IEC60730 Annex H standard documents the requirements for electronic controls. It contains detailed tests and diagnostic methods to ensure the safe operation of embedded control hardware and software for household appliances.
The framework is used to debug the failure in the integration test and regression test. The user is able to detect the failure and rectify accordingly, without stopping the test activity.
A. Setup
The Class B self-test routines are integrated into the DUT debugging framework. The routines are classified into 2 groups:
- Class B startup routines
- Class B runtime routines
Startup routines contain the checking of volatile and non-volatile memories, and the CPU registers, using fix checking pattern. Runtime routines cover the above plus additional logic checking, with the coverage defined by user application.
The startup routines will be executed during the application initialization. Runtime routines will be run continuously together with the user application; they cannot be stopped intermittently as this will affect the user application operation.
Figure 4 & 5 show the integration of the Class B routines (highlighted as grey box) into the framework.
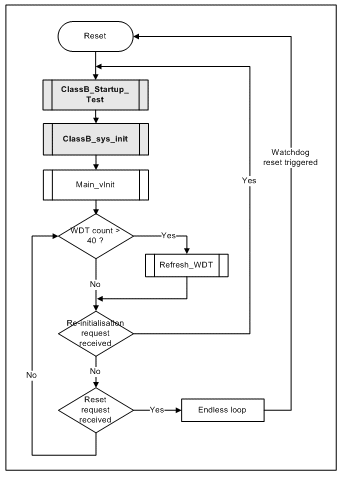
Figure 4: Integration of Class B Startup routines into the framework
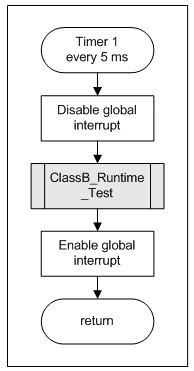
Figure 5: Integration of Class B runtime routines into the framework
As shown in Figure 4, the startup routines will be executed during the initialization before the framework proceeds with the user’s operation. The framework scheduler will execute the runtime routines at periodic basis. A watchdog timer is maintained and service periodically to ensure that the user application does not stuck in infinite loop, else a reset will be triggered.
The results of these routines will be collected using another timer and they are sent to the PC-host via CAN interface. The subsequent section will detail on how the PC-host displays these results in various meaningful ways.
B. Runtime Debugging
Figure 6 and Figure 7 show the screen snapshot of the PC-host software. The snapshots show the necessary debug information, configured by user, to be displayed in both real time and non-real time basis. In this case, the non-real time data is referred to the startup routines statuses, and the real time data show the runtime routines return values.
To further enhance the readability of the real time data, user can choose to use the on-screen oscilloscope to monitor and investigate the changes of the internal states at predefined period, as shown in Figure 6. Timescale can be adjusted on-the-fly. The on-screen oscilloscope can be used to monitor the changes of the internal variables at one glance. This could be more helpful instead of displaying the continuous changes of the internal variables in numerical form.
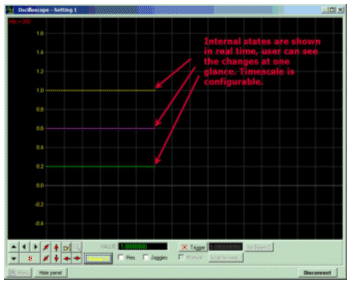
Figure 6: Real time display of the PC-host software
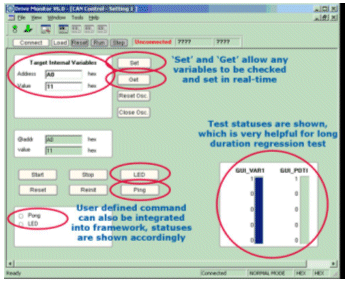
Figure 7: User interface components of the main screen
Figure 7 shows the required debugging information configured for Class B Software Library testing:
- Startup routines statuses can be shown using the LED buttons which indicate either pass or fail.
- The collected real time data can be accumulated and shown as an overall status in bar form, which will be very useful for long duration of regression test.
- One can define custom command which is specific to the debug environment. Example above shows the ping-pong command to test the connectivity between PC-host and the target device.
- As indicated in “Set” and “Get” buttons, user can choose to view and set any of the internal variable state without stopping the application from running. One just needs to provide the memory location of the variable, and the result can be returned immediately.
4. Conclusion
The above framework is proven on an 8-bit MCU, which consists of Class B Software Library, the debugging framework and a lean application layer to integrate the above. It shows the possibility of using a low cost debugging setup to realize the real-time non-intrusive debugging methodology. The results obtained are satisfactory, and the objectives are met.
5. Terminology
- CAN – Controller Area Network
- DUT – Device Under Test
- JTAG – Joint Test Action Group
- Mb/s – Mega bits per second
- MCU – Microcontroller Unit
Related Semiconductor IP
- NPU IP Core for Mobile
- NPU IP Core for Edge
- Specialized Video Processing NPU IP
- HYPERBUS™ Memory Controller
- AV1 Video Encoder IP
Related White Papers
- Design and Real Time Hardware Implementation of a Generic Fuzzy Logic Controller for a Transport/Diffusion System
- How to detect solder joint faults in operating FPGAs in real time
- Anti tamper real time clock (RTC) - make your embedded system secure
- Design guidelines for embedded real time face detection application
Latest White Papers
- Ramping Up Open-Source RISC-V Cores: Assessing the Energy Efficiency of Superscalar, Out-of-Order Execution
- Transition Fixes in 3nm Multi-Voltage SoC Design
- CXL Topology-Aware and Expander-Driven Prefetching: Unlocking SSD Performance
- Breaking the Memory Bandwidth Boundary. GDDR7 IP Design Challenges & Solutions
- Automating NoC Design to Tackle Rising SoC Complexity