Debug IP for SoC Debug
Cambridge UK
Abstract :
Any developer, but above all the firmware or software developer, building a complex, microprocessor-based embedded product faces an enormous challenge to get a reliable, high performance product to market on time. Embedded debug and trace logic built in to the system-on-chip (SoC) can greatly assist this task.
This paper shows, by example, typical problems encountered by embedded systems programmers and how the new ARM® CoreSight™ technology can be deployed to give the developer the maximum visibility in to the chip’s operations and malfunctions. Issues addressed are: the debug of multiple cores and intelligent peripherals; tracing of multiple, asynchronous, very high frequency processors; debug and analysis of the AMBA™ bus and peripheral activity; maintaining debug visibility of operational systems through very restricted pin connectivity; and interactive debug in real-time without intrusion on system behavior.
DEBUG IP FOR SOC DEBUG
New Challenges
Reliability, Performance, Time-to-Market
SoC designers are well aware of the need for a bug free hardware design, a processor with sufficient performance and the need to tape out on time. But the need to fit the best debug logic is not always uppermost in their mind. It should be. Because in an embedded product it is actually the software, and its interaction with the hardware, that gates the reliability, the effective performance and the release date of the product. Fitting more logic for debug and trace capability may seem costly on precious silicon area, but is likely to have a dramatic effect on the three headline characteristics of the product: reliability, performance and time to market.
The original equipment manufacturers (OEMs) need to differentiate their product from the competition. And where they are using the same or very similar hardware platforms it is essential to optimize the software and thus system performance to maintain competitive advantage. So there is a strong need for system performance analysis, not just debug. Furthermore, as mask costs increase, OEMs and silicon manufacturers are looking to reutilize an ASIC device for multiple applications. Tuning the system to fit different load demands is essential to meet the high performance targets.
Beating complexity
Every 18 months sees a doubling of integration levels on-chip; this leads to increased complexity, of hardware, of embedded software and of their interaction. And complexity rises exponentially for a linear growth in integration levels. Indeed some companies will deliberately limit the levels of integration, and optimization of that integration, to simplify the design, for example by keeping software stacks completely separate and independent. This is the simple approach, but not one that maximizes the functionality or performance of the system. A vital tool to beat complexity is better visibility of what your target system is doing and for this you need the right hooks in your embedded hardware.
Put simply, a design team would be extremely ill-advised to attempt most of today’s embedded product designs without excellent debug visibility. Although you wouldn’t find failure stories on the web, catastrophic product development failures due to the inability to debug or reach adequate performance levels do happen to those who do not address the debug needs of their software teams.
Heterogeneous, Asynchronous, Multi-core Devices
Multiple ARM and DSP designs are not new, although increased integration levels are seeing their percentage of the market increase. However, the rise of multimedia within embedded applications, using digital signal processing functions, means software engineers care more about programming and thus debugging heterogeneous, multi-core devices. Also, more complex clock control mechanisms for power saving, such as ARM’s Intelligent Energy Manager (IEM) technology, mean asynchronous, variable clocks are becoming the norm.
The most common problems occur when the developer need to stop all cores in the system at the same time and advance them in lock step. Stopping only one core, but allowing the other(s) to run on and overwrite any shared data, prevents the programmer from seeing the true system state. So the problem cannot be found because it has been covered up.
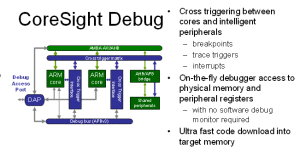
ARM’s CoreSight Debug system provides a simple, but powerful cross triggering system to pass debug events between cores so that a break or trigger in one core will signal immediately to any other core or intelligent peripheral to break or trigger.

Click to enlarge
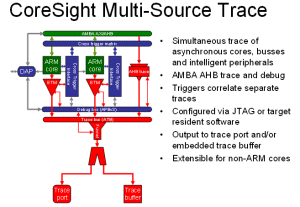
Furthermore, in an application where the ARM is sending control requests to the DSP which is flowing back occasional status data, a situation may arise where a control request never gets honored or locks up the DSP. Thus the developer needs to see not only the context of both, but also what set of events led to it. Correlated trace allows the cause to be found. This is true of handshakes, mailbox lockout issues, back-off algorithms, live-lock, deadlock, and the many other inter-processor situations where a pure stopped snapshot does not provide enough information. ARM’s CoreSight Multi-Source Trace system provides simultaneous trace of multiple sources. Traces are cycle accurate and correlated at the trigger point.
Increase in Bus Architecture Complexity
The vaste majority of ARM-based chip designs today contain more than one bus master (e.g. for intelligent peripherals, DMA controllers or multiple cores) and many use a multi-layered AMBA™ bus architecture where simultaneous bus access by different bus masters to different peripherals is supported. Not all system activity and performance can be inferred from watching the central processor(s).
Visibility of the internal bus activity is required but not available at the pins of the device. Debugging and optimization of software and systems requires an event profile of bus activity correlated to the core(s) activity.
Bus trace is used to get timing analysis of access to peripherals. Common problems to be overcome include: over or under stimulation (beyond allowed min/max timings) such as pushing into a data register too fast or too slow; overly long delay between interrupt assert by peripheral and master reading the data; analysis of actual data sent from multiple masters to a single place to track down shared memory problems; badly mixed data stored to peripherals from multiple masters; interaction problems between a DMA controller and the core; and analyzing bus fabric problems such as mastering issues, store and forward problems, imprecise abort sources, and many more.
The performance of any system may be limited by the bus, but with multi-master systems a poorly balanced system may be spending more time waiting for the bus than executing useful work. Actual performance is application-dependent. Empirically collected data on the bus utilization while the application is running under best, typical and worst case loadings are vital to optimizing the system.
ARM’s CoreSight AHB Trace Macrocell provides the features that give full visibility to any AMBA AHB activity that will enable the developer to debug and optimize their system. Conditions recognized by trace macrocells are passed to the cross triggering matrix to generate system breaks or correlate with traced core activity.

Click to enlarge
On-the-fly Data Access
Many embedded systems can only be debugged and optimized when operational due to the data dependent or real-time nature of the application. In other words, the processors need to be running at their full operational speed. Traditionally, a debug monitor such as ARM’s RealMonitor provides this service. However, a better solution makes no, or extremely limited, use of the processor’s execution time and requires no software to co-reside with the application or OS code. Instead hardware support gives the debug tools direct access to the target system’s physical memory and peripheral registers. ARM’s CoreSight Debug provides an access port into the AMBA system, acting as a bus master, to do just this.
The developer can now interactively debug the running system as it will behave when fully deployed in its real environment. Perfect for calibrating automotive systems, for viewing system variables in real-time and logging them for later analysis to ensure they did not go out of range or reach levels that might indicate a problem had developed in the system under test.
Many developers have very large code images to download into target memory. The CoreSight debug access port enables ultra fast code download as it is no longer bottle-necked by scanning address and data values in to the processor register via JTAG and getting the processor to do a store to memory.
Higher Frequencies, Less Pins
The continuous improvements in silicon process technologies have delivered increased levels of on-chip integration and higher operating frequencies. Put simply there is a lot more going on inside the chip that you cannot see from outside. ARM’s Embedded Trace Macrocell™ (ETM) technology has for the last 7 years helped resolve this, but now two new features of the new CoreSight ETMs go even further. First, a seven-fold improvement in instruction trace compression rates mean multiple cores or higher performance cores can still be traced through an affordably sized trace port. Data compression is also 25% better. Second, an asynchronous trace port supports cores operating in the high 100s of MHz or with variable clocks, while optimizing for the speed at which trace data can be collected to maximum affordable bandwidth. In other words, CoreSight ETMs supply maximum visibility off-chip whatever your system characteristics.
The higher compression also increases the effective depth of an embedded trace buffer, also part of ARM’s CoreSight Multi-Source Trace solution. A CoreSight ETM will generate on average 1 byte of instruction trace data for every 7 cycles , or 28,000 lines of code for a 4k byte trace buffer.
The plus side for higher levels of integration is that there are a lot more gates available for the design, including some debug logic.
Very Limited Debug Connectivity
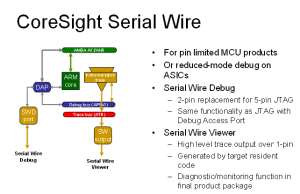
ARM cores are used in a wide variety of application market segments: wireless, networking, storage, automotive, digital imaging, consumer entertainment, security and industrial. As well as those on the bleeding edge of process technology there are many on the bleeding edge of cost reduction, especially for MCUs. Here pin count is frequently the dominant factor in cost control, moving down a package size is the goal. To meet this requirement ARM’s CoreSight solution contains two innovative new developments: Serial Wire Debug, a 2-pin replacement for conventional 5-pin JTAG; and Serial Wire Viewer a 1-pin output port for diagnostic monitoring tool for running targets.

Click to enlarge
Often the developer needs to debug the actual end product, like a mobile phone, with very limited interconnect. Here the Serial Wire Viewer is useful deployed in more complex ASICs as well pin limited devices. The product manufacturer needs to provide the application developer with debug and trace capabilities while protecting the system security. The developer needs basic ‘printf-style’ debugging of application code, trace of OS tasks and monitoring of data variables while in real use. Serial Wire Viewer provides a debug port driven by the application software which delivers all this
Performance issues such as the amount of time spent in your applications versus that spent in the OS kernel, can be recorded and optimized through this limited bandwidth high level trace system.
A Complete Solution
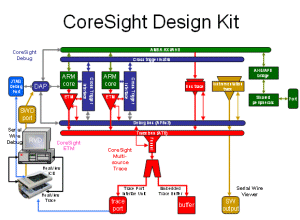
When putting together a debug and analysis tools strategy for your product development it is vital to look at the overall solution of on-chip support, external debug equipment and the software tools. ARM, as a provider of all elements in the debug toolchain, ensures this with its CoreSight technology on chip and range of RealView® development tools.

Click to enlarge
The author:
As Product Manager, William Orme is responsible for the next generation of embedded debug and trace logic for ARM and its Partners. Since joining ARM in 1996, he has focused on solutions for the debugging of deeply embedded cores.
William has twenty years experience in the embedded systems market. He began his career with Data Logic Limited designing single board computers for dealing room systems in the City of London, then moved to designing industrial automation, robotics and rack systems for HS Elettronica Progetti in Bologna, Italy.
Before joining ARM, William developed smart card processors and system software at GIS (General Information Systems) Limited in Cambridge, UK.
Related Semiconductor IP
- NPU IP Core for Mobile
- NPU IP Core for Edge
- Specialized Video Processing NPU IP
- HYPERBUS™ Memory Controller
- AV1 Video Encoder IP
Related White Papers
- Greater Debug of a SoC having heterogeneous ARM Core's
- ARM intrusive debugging for post-silicon SoC validation
- Co-Design for SOCs -> On-chip support needed for SOC debug
- Co-Design for SOCs -> Software debug shifts to forefront of design cycle
Latest White Papers
- Ramping Up Open-Source RISC-V Cores: Assessing the Energy Efficiency of Superscalar, Out-of-Order Execution
- Transition Fixes in 3nm Multi-Voltage SoC Design
- CXL Topology-Aware and Expander-Driven Prefetching: Unlocking SSD Performance
- Breaking the Memory Bandwidth Boundary. GDDR7 IP Design Challenges & Solutions
- Automating NoC Design to Tackle Rising SoC Complexity