Performance verification of a complex bus arbiter using the VMM Performance Analyzer
Kelly Larson, John Dickol and Kari O’Brien, MediaTek Wireless, Inc.
Performance verification of system bus fabrics is an increasingly complex problem. The bus fabrics themselves are growing in complexity, and an exact performance model of the entire bus fabric may not be available for reference. Performance bugs are often architectural in nature and, therefore, very difficult to fix. As a result, it is necessary to find a way to accurately validate the performance of complex bug fabrics early in the design flow.
VMM Performance Analyzer offers tools to make performance validation of bus systems easier. This application provides a flexible mechanism for capturing arbitrary user-defined performance data and saving it to an SQL database for subsequent analysis. In effect, it allows us to both select the important performance characteristics of our system and then gather performance results from large numbers of transfers through that system.
This paper describes how we used the VMM Performance Analyzer to complete performance validation for an AXI bus arbiter. We begin with an overview of the Device Under Test and its existing VMM functional testbench. Next, we discuss the capabilities of VMM Performance Analyzer and show how it was added to the testbench. Then, we show how we collected and analyzed the resulting performance data. Finally, we conclude by summarizing our results and discussing future work using this methodology.
Bus arbiter verification
Verification of a bus arbiter requires both functional verification and performance verification. Functional verification includes testing that accesses are successfully passed through the arbiter and that the arbiter eventually grants all requests. Performance verification is more subtle and involves testing whether the arbiter’s intention to provide specified bandwidth and latency to each master is fulfilled.
Performance verification can implement a cycle accurate model of the arbiter in the testbench. While this method can measure whether the algorithm is correct on each cycle, it makes no evaluation of the performance characteristics from a bus master perspective.
An alternative methodology is to measure arbiter performance from a high-level application perspective. Whether one master or another is granted the bus on a particular cycle does not necessarily impact the ability of application software to execute in its allotted time. However, inability of a certain master to gain average bandwidth over an extended period of time can be a fatal failure. It is this type of failure that we have used VMM Performance Analyzer to locate.
Design under test
The design under test for performance verification is an AXI bus arbiter for an embedded memory subsystem. Ten different masters with a variety of access characteristics must access the memory. The memory supports simultaneous accesses to different banks. The purpose of the arbiter is to guarantee a programmed amount of bandwidth to each master without starving any master. A multi-level AXI arbitration scheme is employed.
Memory subsystem
The memory subsystem contains many banks of level 2 (L2) embedded SRAM memory. The memory banks are single ported and can complete one access per cycle. Each memory bank has a round robin arbiter to select between accesses from the two functional domains in the system. Each domain has multiple AXI masters whose accesses are arbitrated based on a programmable bandwidth allocation target. The block diagram of this subsystem is shown in Figure 1.
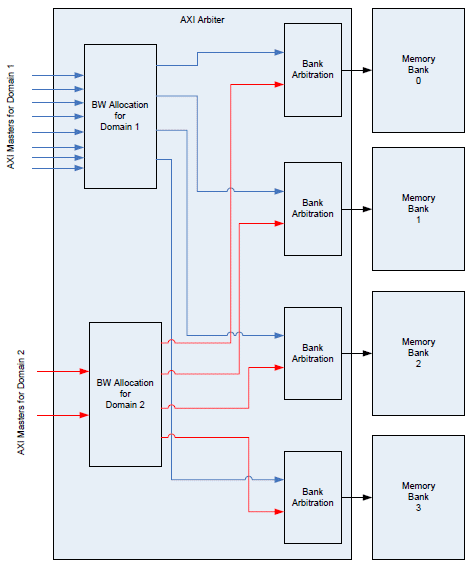
Figure 1: Block diagram of memory subsystem
All of the masters accessing the memory adhere to AXI protocol. However, each master has a different access profile. For instance, DMA engines can issue small bursts or single transfers while processors can issue cache line fills or single accesses. The main arbitration occurs on the address channels, but the number of data channel transfers is taken into account for bandwidth calculation. Only one master can win address channel arbitration in each domain bandwidth allocation arbiter on each cycle. In the case of a burst access, the accompanying data transfers can take place over many subsequent cycles. However, only one data access is permitted per memory bank per cycle. The arbiter must ensure this when granting new transfer requests.
Arbiter configuration
The arbiter can be configured in many ways. Some of the important parameters are the bandwidth allocation for each master and the maximum latency allowed for each master. These are configured independently on an individual master basis. In addition, there are different modes of operation for the bandwidth allocation arbiters and the bank arbiters. These parameters are controlled through APB control registers. Table 1 summarizes these parameters.
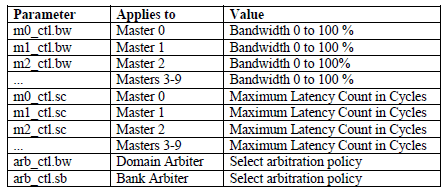
Table 1: Arbiter configurable parameters
Verifying arbiter performance The performance verification of this arbiter requires capturing the time of various events in the AXI protocol and then using them to calculate bandwidth and latency for each master accessing the arbiter. AXI is a burst-based protocol. Transactions have an address and control phase, followed by one to sixteen beats of data. Address or data information is transferred when the corresponding VALID and READY signals are both high.
The timing of each valid address, each read data response, and each write data accepted must be tracked. These individual events are then analyzed over the duration of a single simulation and over multiple simulation runs.
Figure 2 shows a typical 4-beat AXI read burst transaction and the timing information needed for performance analysis. Similar timing information is needed for AXI write bursts.
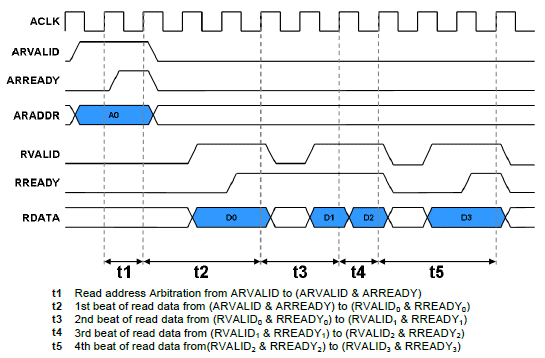
Figure 2: Typical timing data needed for performance analysis
Verification methodology
Functional verification was done using a typical VMM [1] testbench topology as shown in Figure 3. Synopsys DesignWare AXI Master transactors [2][3] were used to drive AXI transactions into the DUT. These AXI master transactors were driven by VMM atomic generators.
The VMM Data Stream Scoreboard [5] was used to verify correct operation of the DUT. DesignWare AXI Port Monitor transactors observed transactions on the AXI interfaces of the DUT and sent those transactions to the scoreboard to be checked. AXI protocol compliance was checked using the ARM AXI assertions package [8].
This testbench was very similar to the testbench presented in [4]. That document provides additional details about the use of these verification components.
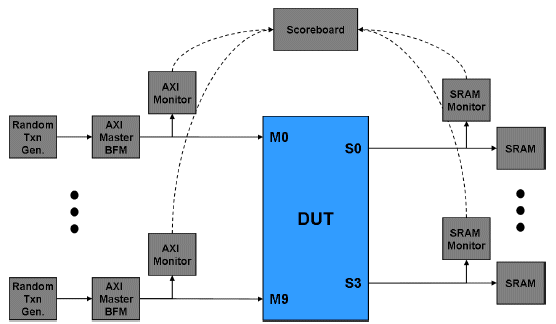
Figure 3: Testbench block diagram
Performance data collection capabilities
The DesignWare AXI Port Monitor transactor was adequate for functional verification but did not capture the detailed transaction timing information needed for performance verification. The only information available was the start and stop time for the entire transaction. The intermediate timings were not available. To solve this, we created our own AXI port monitor, which did capture the desired timing information. The transaction class for this monitor is shown in Figure 4. The class properties prefixed by “c_†(e.g. c_start, c_end, etc.) are absolute time in cycles of the indicated events in the transaction. (Note: a subsequent release of the AXI Port Monitor did provide the desired timing information, but by this time we had already implemented our own transactor.)
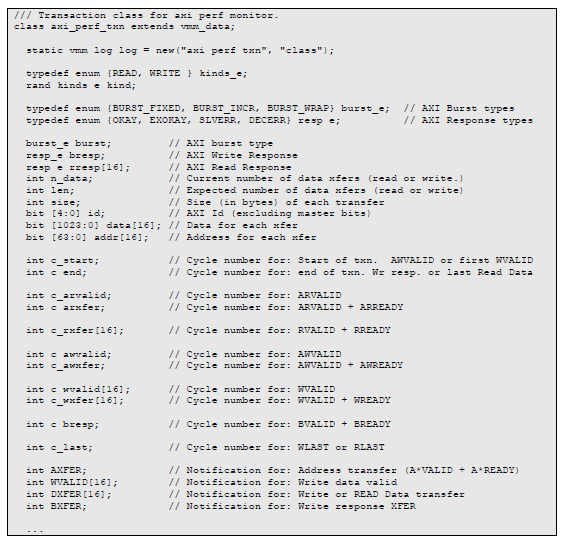
Figure 4: Transaction class for AXI Performance monitor xactor
Performance analysis
To collect and organize the testbench performance data, we used the VMM Performance Analyzer [7] application from Synopsys. This VMM add-on ships with current versions of VCS or is available from the VMM Open Source release at (www.vmmcentral.org). Performance Analyzer version 1.1.6 was used for the work described in this paper.
The Performance Analyzer application provides a flexible mechanism for capturing information about “tenuresâ€, which are defined in [7] as “any activity on a shared resource with a well-defined starting and ending point.†In our testbench, the VALID -> READY delays t1, t2, etc. in Figure 2 correspond to performance analyzer tenures.
The application stores tenure information in a Structured Query Language (SQL) [9] database. This may seem like an overly complicated implementation, but the use of an external database enables complex analysis of the performance data collected from multiple simulation runs. This multi-run analysis would not be possible if, for example, the performance analysis were done using SystemVerilog code in the testbench.
The Performance Analyzer provides native support for SQLite [10] databases. An ASCII text format is also available for interfacing with other SQL implementations. Because our design center uses MySQL [11], not SQLite, we used the ASCII output format and imported the resulting data into MySQL.
Adding the VMM Performance Analyzer to the testbench
The performance analyzer setup is done in the build() method of the testbench environment as shown in Figure 5. The first step is to create the SQL database interface. This is done by creating an instance of the vmm_sql_db_ascii class. (There is a similar class available for accessing SQLite databases.) The constructor for this class requires a string specifying the name of the database file to be created. To avoid name conflicts when running simulations in parallel, we need a unique name. The performance analyzer provides a convenient solution for this through the use of placeholders in the name string. In our example, the %h, %t and %s are replaced by the host name, system time and simulation seed respectively. The expanded name will be unique. Other placeholders are available; see [7] for details. Next, we record some configuration information about the current simulation in an auxiliary data table. This is done with the create_table and insert methods of the database object. Arbitrary column types can be created and filled using standard SQL syntax. Each measured resource requires an instance of the vmm_perf_analyzer class. Our testbench had 33 such instances:
- 1 for the address arbitration (read or write)
- 16 for read data transfers (one for each of 16 possible beats in an AXI read burst)
- 16 for write data transfers (one for each of 16 possible beats in an AXI write burst)
We use the unique database name to create the name for each vmm_perf_analyzer instance. We also add an extra data column, “stampâ€, which will record the actual simulation time in nanoseconds for the completion of each tenure. This is in addition to the existing start and stop times which are recorded as cycle counts. This timestamp is not used for the performance analysis, but is helpful when debugging a performance simulation. Knowing the time a tenure completes makes it easy to locate the specific tenure in a waveform display.
Lastly, we register a callback with each AXI port monitor instance. This callback, shown in Figure 6, is called at the start of each transaction observed by the AXI monitor. After the completion of each AXI address and data transfer, the callback uses the add_tenure method to add a new performance tenure to the respective vmm_perf_analyzer instance. This tenure contains the start and stop cycle numbers, the initiator ID (AXI master number), target ID (SRAM bank number) and the timestamp.
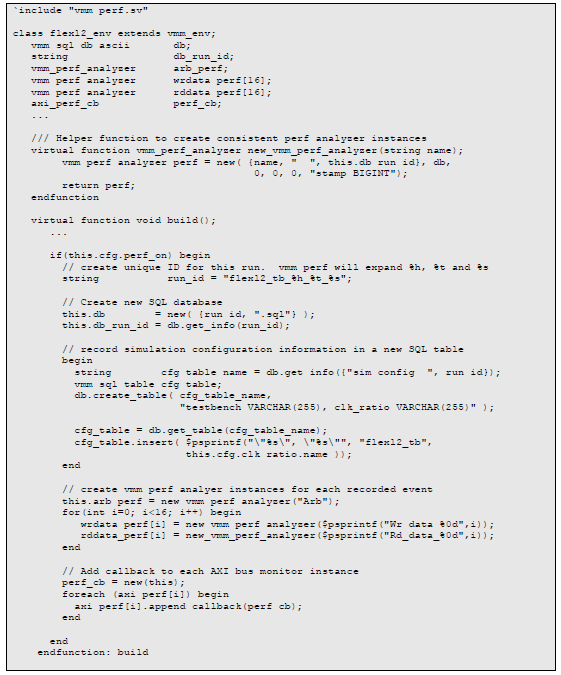
Figure 5: Testbench code to set up VMM performance analyzer
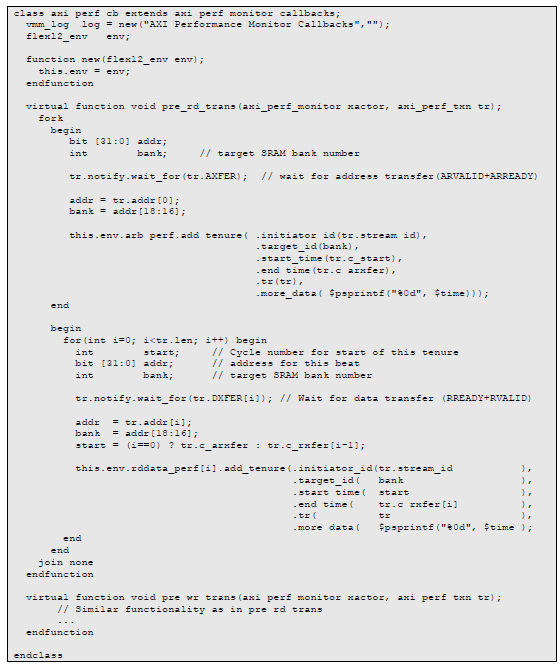
Figure 6: Performance analyzer callback for AXI port monitor transactor
Reporting performance data
At the end of the simulation, after the performance analyzers have collected all of the desired data, we report a summary of the performance data and save this data for subsequent analysis. This is done in the environment’s report method, shown in Figure 7.
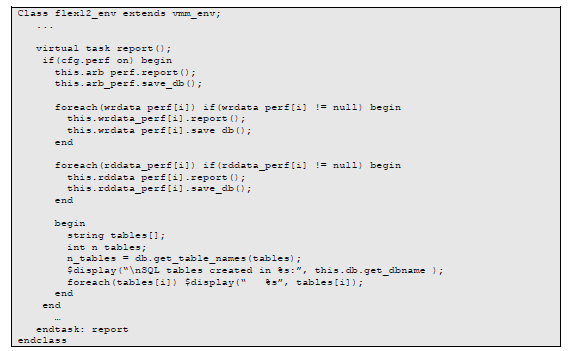
Figure 7: Testbench code to save and report performance results
For each instance of vmm_perf_analyzer, a report method prints a brief summary of the analyzer’s performance data. This report contains only a very basic analysis of the data. A sample of this report output is shown in Figure 8.
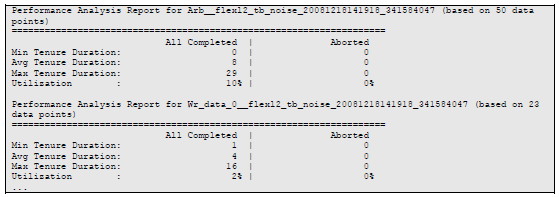
Figure 8: Sample output of built-in report method
The save_db method writes out a series of SQL commands to the ASCII text file. An excerpt of these commands is shown in Figure 9.

Figure 9: Example SQL commands generated by Performance Analyzer
These commands, when run on the SQL database, produce a series of SQL tables similar to those shown in Figure 10. The vmm_runs table is a master list of all simulation runs. Each row in vmm_runs corresponds to a single simulation. The “tables†entry contains the name of a uniquely-named table containing the names of the tables created during the simulation. This “tables table†contains both user-defined tables (such as the sim_config table we created previously) and a table for each vmm_perf_analyzer instance. These tables can be distinguished by the “datakind†entry. A value of 0 indicates a performance analyzer table; a non-zero datakind is a user-defined table. Each performance analyzer table contains the tenure information (start & stop cycle numbers, initiator and target IDs, and timestamp) for each tenure collected by that analyzer.
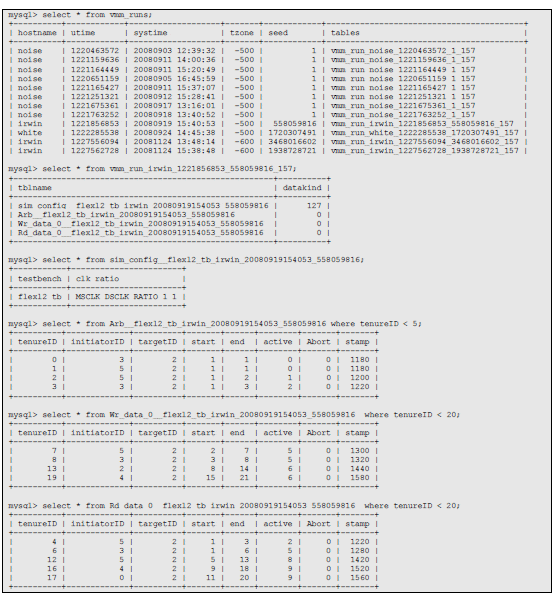
Figure 10: Example SQL tables created by Performance Analyzer
Performance data analysis The VMM performance analyzer generates SQL data for analysis. SQL is a database environment that is good for managing multiple data sets, as in the case of data from different tests or different RTL models. However, it is difficult to perform statistical analysis within the constraints of SQL. Therefore, we convert the SQL data to Perl structures using a Perl module (use Mysql) for easy manipulation. Through the Perl interface, the database can be queried with standard SQL commands and the results of the query can then be processed using Perl. First the run results are loaded into the SQL database. Assuming the SQL commands generated by the testbench are in an ASCII file run_file.sql, the following command loads the results into the vmm_perf_data database on database host db_host: mysql -- host db_host vmm_perf_data < run_file.sql The following perl script then enables access to the SQL database.

Figure 11: Example Perl code to connect to SQL database
Standard SQL database queries such as “SELECT * FROM vmm_runs;â€, which selects all of the entries in a table called vmm_runs, can then be executed in Perl.

Figure 12: Code example of database commands executed in SQL and in Perl
Each row of the table is returned in the array @datavalues, where each index corresponds to the value of a different column in the table. After obtaining the table values from the SQL database, standard Perl statistics can be used to analyze the arbitration latency for each master and the bus utilization for each master. The following code excerpt shows the statistical calculations for arbitration latency for a single simulation run. This is a simplified example; actual analysis would make use of the results from multiple simulations.
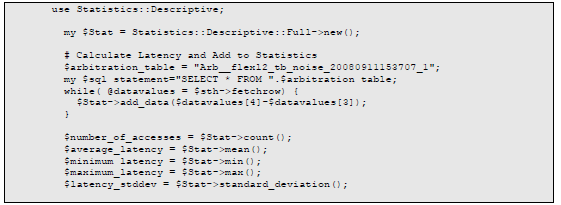
Figure 13: Code example of statistics processing in Perl
Results
Raw data can be plotted on a graph for any of the characteristics that are logged in the database. For instance, Figure 14 shows the arbitration latency for different masters plotted across simulation time. In this example, all masters are programmed for equal bandwidth access of 10 percent to the memory.
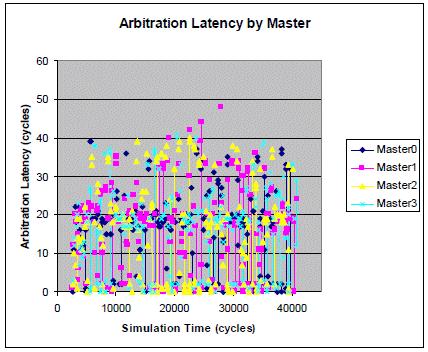
Figure 14: Graph of raw data arbitration latency by master
Since the raw data shows all the variation in latency due to resource conflicts, we measure summary statistics and then graph averages over short time scales (example 500 cycles). Table 2 shows an example of the statistics for the latencies measured in Figure 14.

Table 2: Arbitration latency summary statistics
Table 3 shows the bandwidth consumed by each master as averaged over 500 cycle increments. Each data value represents the percent of cycles available that were used by the master to access the memory. This is based on a count of AXI data cycles as opposed to AXI address cycles.

Table 3: Bandwidth measured by Master over short time scales
Figure 15 plots this same data for easy interpretation of how well the bandwidth is distributed.
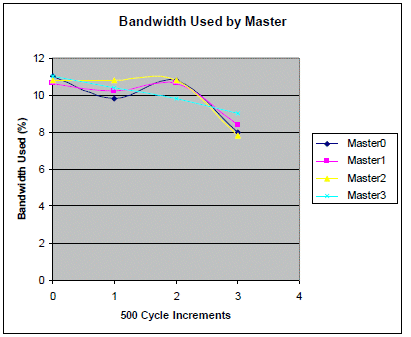
Figure 15: Graph of bandwidth allocated over time
Conclusions We had a very positive experience using the VMM Performance Analyzer. It was easy to add to our existing testbench, and VMM Performance Analyzer provided sufficient flexibility to capture the performance data required for our analysis. The use of SQL to store the performance data initially seemed too complicated, but it provides a way to analyze performance data from several simulations. This was our first usage of the application, and we will deploy it on future testbenches. There are, however, a few things we might do differently the next time around:
- Our current implementation collects only two data points for each performance tenure (start and end). Each AXI address or data transfer is a single tenure. A possible enhancement for future implementations would be to use a single tenure for each complete transaction and add the intermediate timing information to each tenure. This would reduce the number of SQL tables needed per simulation and may simplify the post-processing of the data.
- Lack of direct support for MySQL databases was a minor inconvenience, requiring a separate post-simulation step to import the SQL data from the ASCII test file into MySQL. We would investigate using the SystemVerilog Direct Programming Interface (DPI) to add native support for MySQL (similar to the built-in support for SQLite). The Perfomance Analyzer defines an API for database connections. This API plus the SQLite implementation could be used as a model for implementing a MySQL interface.
- We originally deployed the analyzer in a block-level testbench. But there is also a need for performance analysis when that DUT is reused in a higher-level subsystem or system testbench. Packaging the performance measurement components (vmm_perf_analyzer, callbacks, etc.) in a VMM sub-environment would simplify reuse of this application in multiple testbenches.
Overall, we found the VMM Performance Analyzer to be a powerful addition to the VMM toolbox.
About the authors .
Kelly Larson is verification manager, MediaTek Wireless, Inc. . John Dickol is design verification engineer, MediaTek Wireless, Inc. . Kari O’Brien is SoC Architect, MediaTek Wireless, Inc. References
[1] J Bergeron, E. Cerny, A. Hunter, A. Nightingale, “Verification Methodology Manual for SystemVerilog,†Springer, 2005.
[2] Synopsys, “Using the DesignWare Verification Models for the AMBA 3 AXI Protocolâ€
[3] Synopsys, “Using SystemVerilog with the DesignWare Verification Models for the AMBA 3 AXI Protocolâ€
[4] J. Dickol, “Using Verification IP and VMM Applications to Jumpstart Verification of an AXI Subsystemâ€, SNUG San Jose 2008
[5] Synopsys, “VMM Scoreboarding User Guide†http://www.vmmcentral.org/pdfs/vmm_scoreboard_guide.pdf
[6] Synopsys, “VMM Standard Library User Guide†http://www.vmmcentral.org/pdfs/vmm_standard_library_guide.pdf
[7] Synopsys, “VMM Performance Analyzer User Guide†http://www.vmmcentral.org/pdfs/vmm_perf_guide.pdf
[8] Arm Ltd., “AMBA 3 AXI Specification and Assertions†http://www.arm.com/products/solutions/axi_spec.html
[9] W3 Schools SQL Reference http://www.w3schools.com/sql/default.asp
[10] SQLite website http://sqlite.org
[11] MySQL website http://www.mysql.com
Related Semiconductor IP
- NPU IP Core for Mobile
- NPU IP Core for Edge
- Specialized Video Processing NPU IP
- HYPERBUS™ Memory Controller
- AV1 Video Encoder IP
Related White Papers
- Product how-to: Reliable SoC bus architecture improves performance
- Amba bus may move MIPS into ARM territory
- Bus protocols limit design reuse of IP
- SoCs: Design tools -> Bus protocols limit design reuse of IP
Latest White Papers
- Ramping Up Open-Source RISC-V Cores: Assessing the Energy Efficiency of Superscalar, Out-of-Order Execution
- Transition Fixes in 3nm Multi-Voltage SoC Design
- CXL Topology-Aware and Expander-Driven Prefetching: Unlocking SSD Performance
- Breaking the Memory Bandwidth Boundary. GDDR7 IP Design Challenges & Solutions
- Automating NoC Design to Tackle Rising SoC Complexity