Have Benchmarks, Now What?

DevStudio's performance matrix holds thousands of compile-and-profile results across the Chimera GPNPU configuration space. Here's how to use it to converge on the handful of configurations worth taking to tapeout, and what the matrix can and can't tell you.
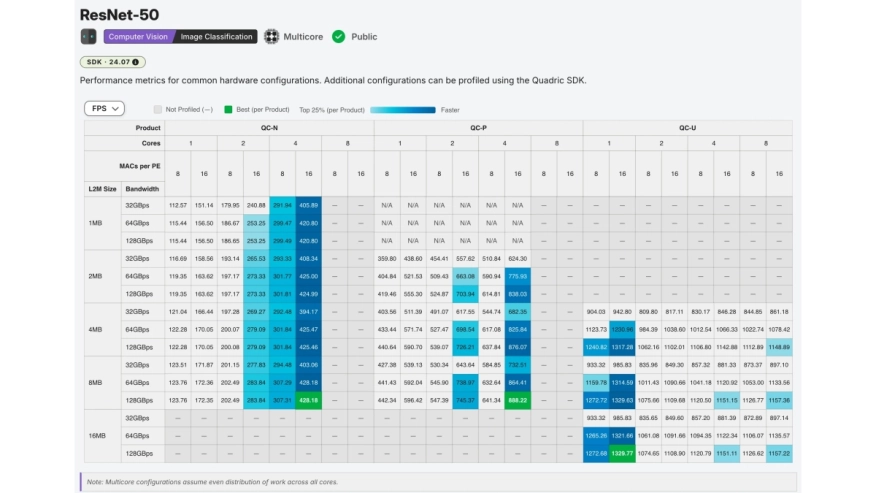 We've written before about how the performance matrix in DevStudio gets built: every Chimera™ SDK release automatically recompiles and re-profiles the entire model zoo across a broad sweep of hardware configurations, and the results land in DevStudio for anyone to browse. That post was about how the matrix exists and why you can trust it, and this one is about the other half: how to actually use it to pick the configuration you're going to build.
The Spreadsheet You Were Going to Build
Every SoC sizing exercise we've seen starts the same way: someone opens a spreadsheet. Columns for candidate configurations, rows for models, and cells filled in from whatever sources are at hand: a vendor brief here, an NDA deck there, a number a colleague remembers from a call six months ago. Half the cells are empty, the other half were measured on different SDK versions, and nobody can say which. The spreadsheet then gets emailed around, forked, and quietly diverges into three incompatible copies owned by three different teams.
A hosted platform makes that artifact unnecessary. Every metric in DevStudio comes out of the same automated pipeline, on the same SDK release, and lives in one place that your whole team can open; the hardware architect, the data science team, and the application engineers are all looking at the same numbers. There's no version-skew argument to have, because there's only one version.
You Can't Reason Your Way to the Optimum
The deeper reason to use a large configuration matrix is that sweeping the space is the only way to actually find the performance a specific architecture would otherwise leave on the table. Back-of-envelope math from peak TOPS tells you almost nothing about where a real workload lands: whether a model is compute-bound or bandwidth-bound, whether a larger L2 Memory eliminates external memory traffic entirely, whether doubling MACs per PE helps a network that spends most of its cycles on data movement. These effects are properties of the model and the architecture together, and the only honest way to expose them is to compile and profile the model on each configuration and look.
That's what the matrix is: thousands of compile-and-profile jobs, already run, with per-region breakdowns of where the cycles go: compute, MACs, on-chip memory, external memory. The performance you'd otherwise miss is sitting in a cell somebody already computed.
From Thousands of Cells to a Shortlist
Nobody tapes out a matrix. The point of the sweep is to converge: start from the models that represent your product's expected workload, read across the configuration space, and narrow to a handful of candidate configurations that are all plausible. Then flip the comparison around: instead of one model across many configurations, look at your whole model mix across those few candidates. That second view is the one that matters for a real product, because your application doesn't run one benchmark in isolation; it runs a mix of workloads, at scale, inside a power and area budget.
Tradeoffs Your Whole Team Can Argue About
Because the matrix is self-serve, the hardware conversation stops being gated on the hardware team. A data science or application team can engage directly in hypothetical tradeoffs – power and area on one axis, inferences per second, tokens per second, or FPS on the other – and come to the table with data instead of instinct.
The answers are workload-shaped and sometimes surprising. Take core count on QC-Ultra (8 MB L2 Memory, 128 Gbps AXI, 16 MACs per PE), straight from the live matrix:
| Model | 2 cores | 4 cores | 8 cores |
|---|---|---|---|
| ResNet-152 — FPS | 616 | 630 | 632 |
| ResNet-152 — FPS/W | 153 | 75 | 38 |
| ViT-Base — FPS | 112 | 111 | 112 |
| ViT-Base — FPS/W | 36 | 18 | 9 |
For a ResNet-class backbone, throughput saturates almost immediately: going from two cores to eight buys about 2% more FPS while perf-per-watt falls by 4×. If ResNet-style workloads are what your product actually runs, a small configuration is the right answer, and the matrix will tell you so before you spend the area. A more complex network tells the opposite story: the YOLOP segmentation backbone climbs from 510 FPS on two QC-Ultra cores to 883 FPS on eight, because it has the parallelism to feed them. Same product family, opposite conclusion; the deciding input is your expected workload mix, and that's exactly the input your data science team owns.
What the Matrix Won't Tell You
An honest matrix deserves honest caveats, so here they are.
Every number in the matrix is a point in time: a specific SDK version compiling for a specific hardware generation. Performance typically improves with SDK releases – we work hard to find those gains without sacrificing accuracy – which means the number you read today is best understood as a floor that will move up, not a constant. Treat the matrix as a guide for your final hardware design: it points in the right general direction and eliminates the clearly-wrong regions of the space, which is most of the value.
The matrix also measures the neural-network portion of your pipeline: the graph that the Chimera Graph Compiler (CGC) lowers to C++ kernels running on the GPNPU. The pre- and post-processing around the network isn't automatically computed in DevStudio; profiling that is still manual work, though in the applications we've seen it's usually a much smaller fraction of the workload than the network itself. Budget for it, but don't expect it to move the ranking.
And the matrix doesn't replace validation on your actual workload. The zoo is broad, but your product is specific: your model variant, your input resolution, and your pre- and post-processing. Once the matrix has narrowed thousands of configurations down to a shortlist, run your own representative workload on those candidates with the Chimera SDK.
Skip the Spreadsheet
The workflow, end to end: open the matrix, sweep the space against the models that look like your product, shortlist a handful of configurations, argue about the tradeoffs with the whole team looking at the same data, then validate the shortlist on your real workload. What it saves you is the months of serialized vendor calls and the spreadsheet you were dreading that would have been stale before you even finished it.
Start with the DevStudio benchmarks, or go straight to a model's performance matrix in the model catalog.
Explore Quadric IP:
- GPNPU Processor IP - 32 to 864TOPs
- GPNPU Processor IP - 16 to 108 TOPs
- GPNPU Processor IP - 4 to 28 TOPs
Related Semiconductor IP
- GPNPU Processor IP - 32 to 864TOPs
- GPNPU Processor IP - 16 to 108 TOPs
- GPNPU Processor IP - 4 to 28 TOPs
- NPU
- RISC-V-Based, Open Source AI Accelerator for the Edge
Related Blogs
- Apache is part of Ansys: now what?
- Now, India to have two semicon fabs!
- What Does Sports and NoC Have in Common?
- What Does Intel Look Like 10 Years From Now?
Latest Blogs
- Tape-Out Readiness Checklist: Engineering Decisions That Prevent Costly Respins
- How Cadence DSPs Put In-Cabin AI Audio On-Chip in SemiDrive's X10
- The Fastest Path to Scalable Photonic Systems: Using Proven IP for both PIC and EIC designs
- Building Trusted AI Agents from the Silicon Root of Trust
- Heterogeneous Computing in Space